Image credit: Tom Merilion/ Save the Children
Monitoring education in the Sustainable Development Goals
Major data gaps in SDG 4 monitoring. Three data sources are key for monitoring progress on SDG 4 indicators.
Household surveys are the foundation for disaggregating education indicators, such as the completion rate, by individual characteristics to estimate global indicator 4.5.1, the parity index. Surveys should be frequent, their questions comparable and their data publicly available. These conditions are met for 59% of countries, corresponding to 87% of the population. Northern Africa and Western Asia has the lowest coverage in population terms (46%). Oceania has the lowest coverage in country terms (29%).
Learning assessments are the source of information on global indicator 4.1.1. While many countries opt to report results from their participation in cross-national assessments, national assessments are also used, for instance for data on reading skills in countries such as China (lower secondary education) and India (primary education). The UIS database shows 26% of countries in Africa have reported reading skills data for the early grades of primary education since 2014, corresponding to 28% of the population. The region has been plagued by serious delays in publication of country reports from the fourth round of the Southern and Eastern Africa Consortium for Monitoring Educational Quality learning assessment and doubts over the validity of its results. The UIS-coordinated Global Data Coalition aims to address the lack of information on donor support to learning assessments in the region and the lack of coordination in donor initiatives.
Administrative data provide information on global indicator 4.c.1, the percentage of trained teachers. About 58% of countries in sub-Saharan Africa have reported data on primary education since 2016 but only 25% on upper secondary education. Of the six most populous countries in the region, only the United Republic of Tanzania has reported the number of teachers in primary education more recently than 2015. Data interpretation suffers from lack of clarity in the definition of trained teachers, a challenge the UIS will tackle with a new international standard classification for teachers, a new process approved at the UNESCO General Conference in 2019.
Target 4.1: Primary and secondary education
By 2030, ensure that all girls and boys complete free, equitable and quality primary and secondary education leading to relevant and effective learning outcomes.
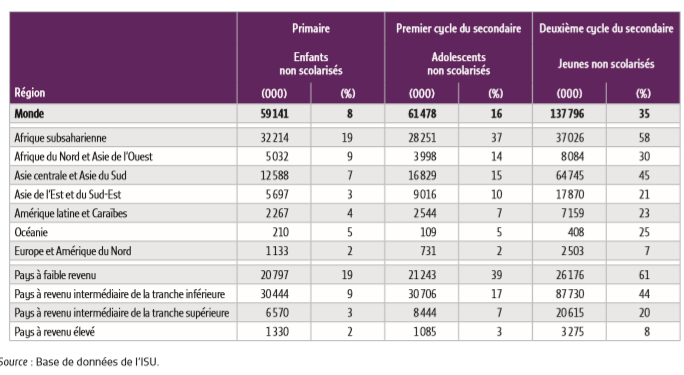
Completion rates stand at 85% in primary, 73% in lower secondary and 49% in upper secondary education. The completion rate diverges from the attendance rate: The former has increased steadily, if slowly, since 2000; the latter has stalled since the mid-2000s. This discrepancy needs to be further investigated. In 2018, sub-Saharan Africa had the most out-of-school children, adolescents and youth, surpassing Central and Southern Asia (Table 1). The trend is expected to intensify. Sub-Saharan Africa is expected to account for 25% of the school-age population by 2030, up from 12% in 1990. It also has the most extreme cases of over-age attendance.
The 2018 PISA data highlight slight regression in high-income countries over the past 15 years (one in five students is below minimum proficiency levels). Stagnation in middle-income countries (one in two students is below minimum proficiency levels) should count as progress, since attendance among 15-year-olds in many, including Brazil, Indonesia and Uruguay, has increased, although the rate of progress is below that required to achieve SDG 4. Attention should be paid to the bottom of the distribution of learning outcomes. The report presents new evidence on ‘floor effects’ suggesting that the number of learners above minimum proficiency in cross-national assessments may have been overestimated in several countries, as that performance could be indistinguishable from random guessing on multiple choice questions.
TABLE 1: Selected indicators on school participation by age group, 2018
Target 4.2: Early Childhood
By 2030, ensure that all girls and boys have access to quality early childhood development, care and pre-primary education so that they are ready for primary education.
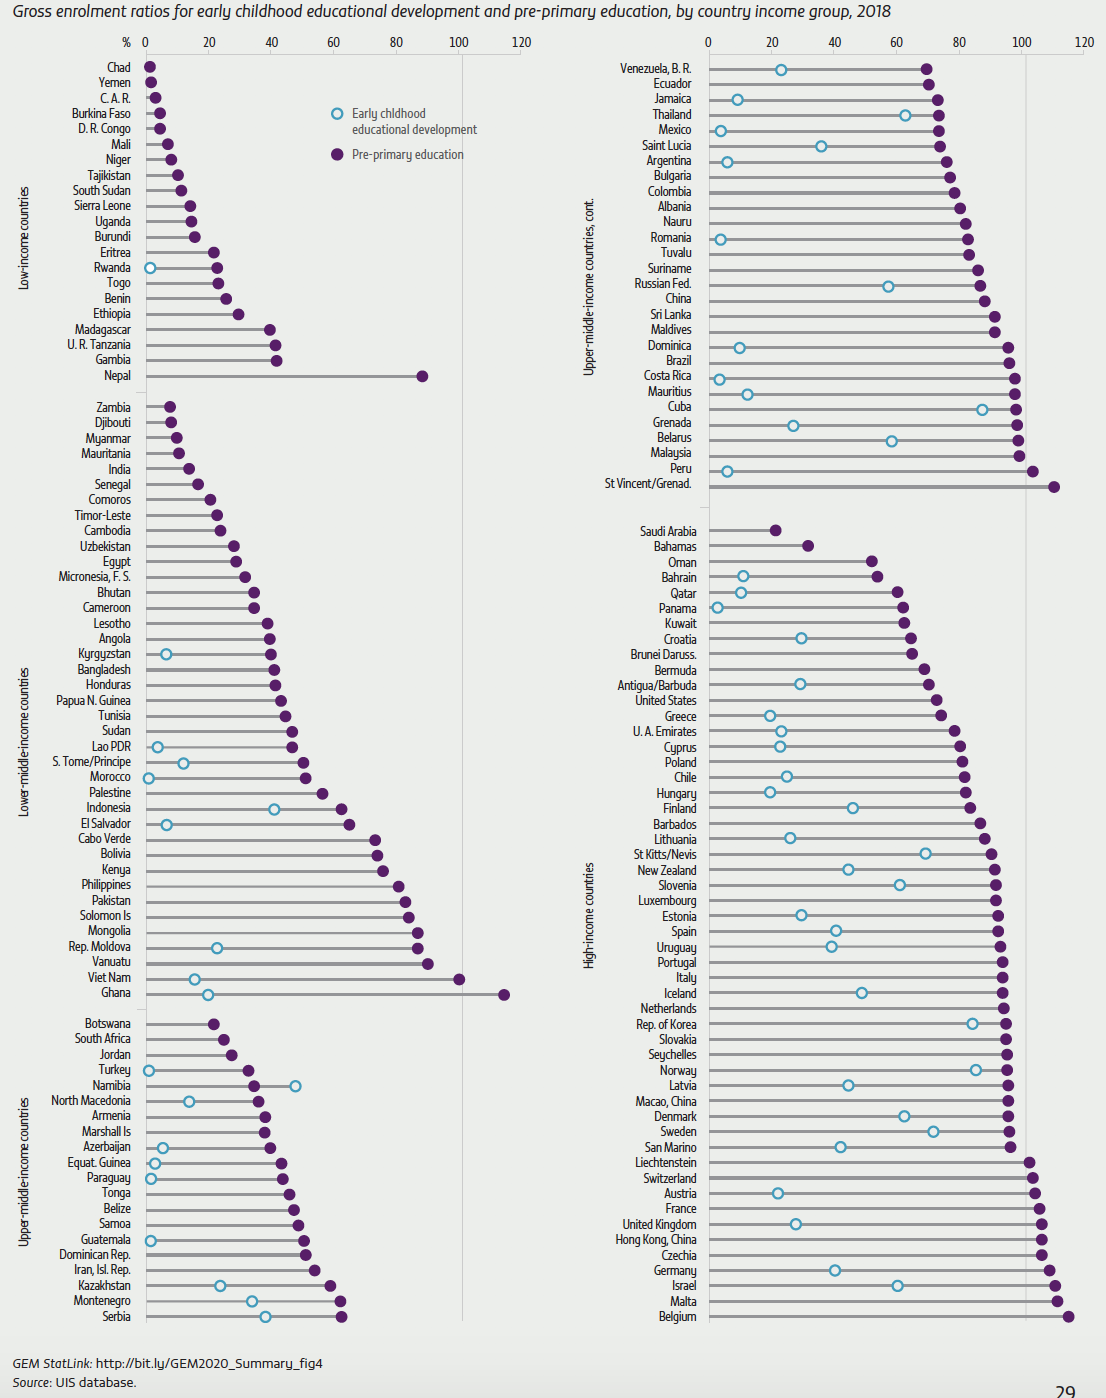
Interpreting data on early childhood education participation depends on how the age group is defined, how different institutional arrangements are captured and country-specific patterns of early entry. For children aged one year younger than primary school entry age, participation in formal education was 67% in 2018 (global indicator 4.2.2; shares ranged from 9% in Djibouti to 100% in Cuba and Viet Nam). Some of the fastest progress was observed in the Lao People’s Democratic Republic, where pre-primary enrolment increased from 38% in 2011 to 67% in 2018. In 9 of 17 countries with recent MICS data, more children in this age group were in primary than in pre-primary school. For children across the entire age range of pre-primary education, which varies by country from one to four years, participation was 52% in 2018; ratios ranged from 1% in Chad to 115% in Belgium and Ghana (Figure 4).
MICS data are used to estimate the Early Childhood Development Index, a measure of the share of children developmentally on track (global indicator 4.2.1). In Mali and Nigeria, just over 60% of children were on track in at least three of the four domains. But the share of children on track in no more than one domain was 5% in Mali and 10% in Nigeria, suggesting greater inequality in the latter.
FIGURE 4: Few in poor countries benefit from pre-primary education
Target 4.3: Technical, vocational, tertiary and adult education
By 2030, ensure equal access for all women and men to affordable and quality technical, vocational and tertiary education, including university.
Northern Africa and Western Asia has had among the most rapid expansion of tertiary education participation in recent years, but there is wide variation by country. In around 2010, about 15% of youth were enrolled in tertiary education in Morocco and Sudan, but while Sudan stagnated, Morocco has seen a rapid increase to 36%. Algeria and Saudi Arabia have rapidly expanded female participation to around two-thirds of young women.
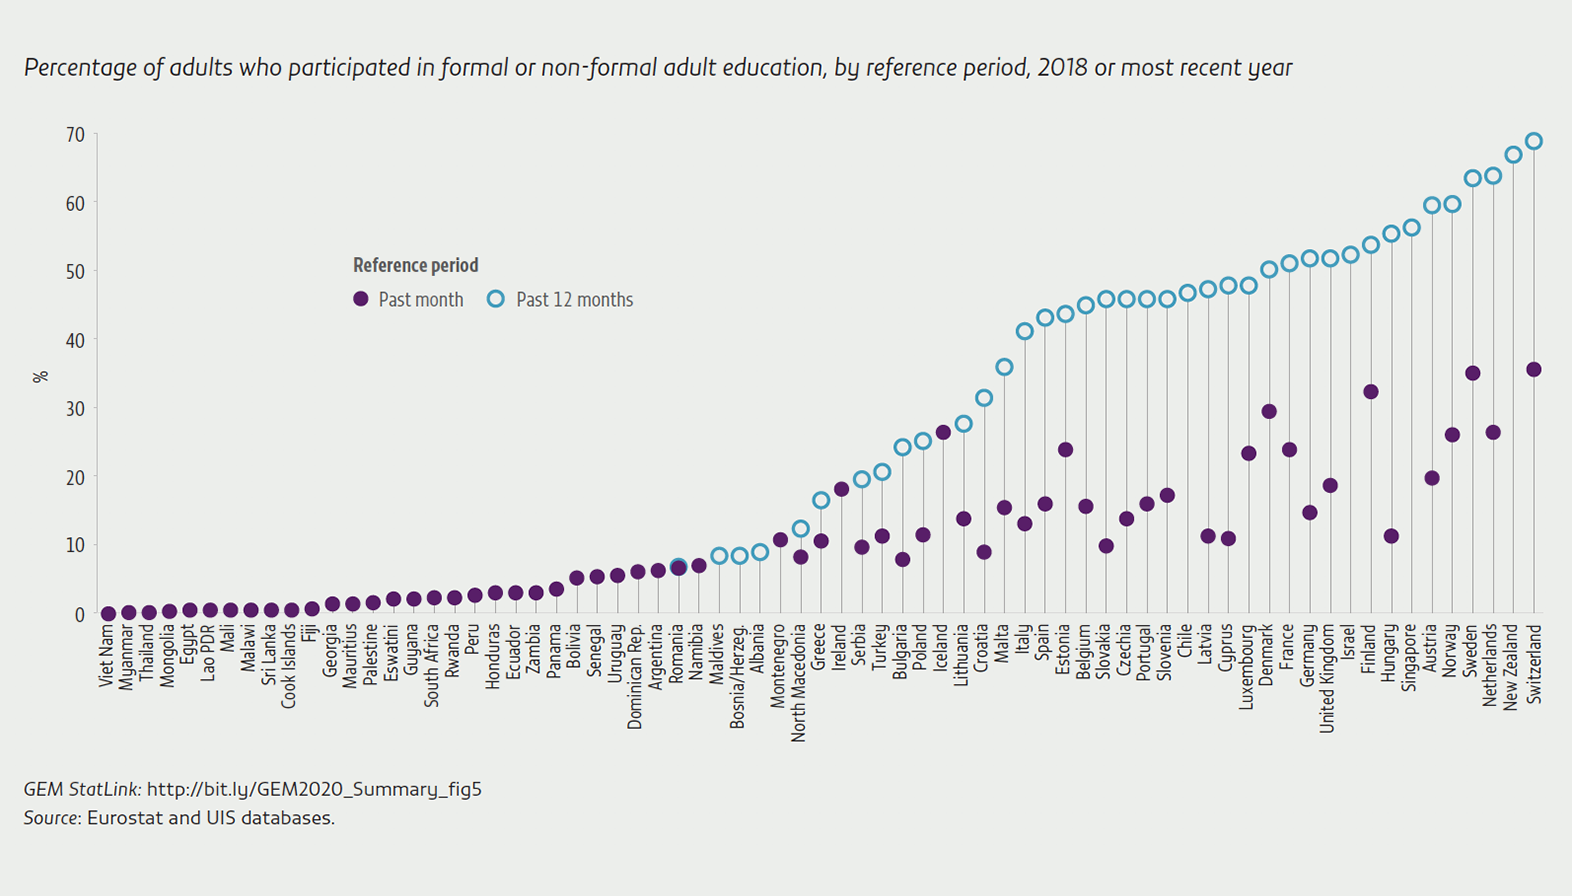
Labour force surveys from the International Labour Organization database have been included as a data source for monitoring global indicator 4.3.1 on participation in adult education and training, increasing coverage from 45 to 106 countries and to regions other than Europe. Challenges remaining include lack of standardized questions on type of adult education and training attended, along with age range variation and reference period misalignment: Many labour force surveys refer to the past month, while the global indicator refers to the past year. The evidence suggests average participation during the month prior to the survey in upper-middle-income countries is just 3% (Figure 5). The 2016 Adult Education Survey provided insights into constraints on participation. Dispositional barriers are generally less investigated but are far more likely to hinder adult learning than others: 60% of respondents said they saw no need to participate in adult learning. In all countries except Denmark, women were more likely to mention conflicts with family responsibilities.
There are almost 11 million people in penal institutions with the right to education but a lack of programmes meeting their needs. Prison education has many benefits: A 2013 study in the United States found that inmates who participated in correctional education had a 13 percentage point lower chance of recidivism than those who did not.
FIGURE 5: Estimates of participation in adult education vary according to the reference period
Target 4.4: Skills for work
By 2030, substantially increase the number of youth and adults who have relevant skills, including technical and vocational skills, for employment, decent jobs and entrepreneurship.
Data availability on basic ICT skills is growing, although it remains heavily skewed towards richer countries. Global indicator 4.4.1 covers nine basic ICT skills; in less than a third of all countries do at least half of adults possess four or more of them, and no low- or middle-income country reports half of adults having more than three of the skills. This year countries are to adopt changes the International Telecommunications Union introduced to the skills set in the recommended questionnaire, e.g. adding skills related to privacy and security.
The European ICT surveys offer insights on digital skills acquisition and the relative importance of school, work and home. Despite ICT skills’ relevance for work, 10% of respondents took part in specific on-the-job ICT training in 2018, and 20% participated in at least one general activity to improve their computer, software and application expertise. ICT skills development more often occurs through free online training or self-study, especially among the young. Although these options help overcome cost, schedule and location challenges, gender gaps persist.
Target 4.4 also envisages entrepreneurship skills development. Over 90% of entrepreneurs in Africa and the Arab States and over 80% in Asia and the Pacific work in the informal sector. Training requirements in these regions should be tailored to microenterprises with limited growth prospects.
Target 4.5: Equity
By 2030, eliminate gender disparities in education and ensure equal access to all levels of education and vocational training for the vulnerable, including persons with disabilities, indigenous peoples and children in vulnerable situations.
Globally, there is gender parity in pre-primary through upper secondary enrolment. However, this hides gaps at the country level. In the bottom quarter of low-income countries, at most 60 girls are enrolled in upper secondary school per 100 boys. In lower-middle-income countries, gender disparities may be at the expense of girls or boys: At most, 92 girls per 100 boys are in the bottom quarter, compared with 91 boys per 100 girls in the top quarter. This Report reviews evidence on the global prevalence of single-sex schools.
Education disparities by wealth commonly compare the bottom 20% of households with the top 20%. As poorer households tend to have more children, cross-country comparisons are distorted if the comparison is between the poorest 20% of children in one country (e.g. Afghanistan) and the poorest 25% in another (e.g. Myanmar).
The addition of the Washington Group Short Set of Questions on Disability in the MICS expands knowledge about disability gaps in education. Differing questions produce differing disability prevalence rates between those up to age 17 (questions based on the Child Functioning Module) and those 18 and over, for whom the rates may decline by around 90%. This hampers interpretation of education indicators calculated over age ranges spanning the groups (e.g. age 17 to 19).
Latin America lacks comparable data on indigenous peoples. While most countries use self-identification, some apply additional criteria in censuses and surveys, including official recognition of identity and language. Demographic shifts have blurred ethnic boundaries and given rise to fluid indigenous identities, meaning different criteria yield different results, including on education indicators. Across household surveys in Bolivia, Guatemala, Mexico and Peru, school attendance among 15- to 17-year-olds is 3 to 20 percentage points lower among indigenous language speakers than among those self-identifying as indigenous.
Target 4.6: Literacy and numeracy
By 2030, ensure that all youth and a substantial proportion of adults, both men and women, achieve literacy and numeracy.
Globally, 86% of adults and 92% of youth are literate. Women remain less likely to be literate, but the gap is closing in the younger generation. These figures include new estimates for 72 countries, including 21 for which the previous national literacy rates were from 2010 or earlier. The number of adults who have not completed primary school will continue declining relatively slowly and may remain above 10% in Africa until the 2050s, even if universal primary completion is achieved by 2030, which means adult literacy will remain a challenge. In 25 countries with relevant data, the adult literacy rate for those with any kind of disability is lower than for other adults, the gap varying from 5% in Mali to 41% in Indonesia.
Results from the third wave of the Programme for the International Assessment of Adult Competencies added evidence on global indicator 4.6.1. Some 51% of adults in Mexico, 71% in Peru and 72% in Ecuador were below minimum proficiency in literacy in 2017. In the United States, the percentage below minimum proficiency in numeracy increased, from 27.6% in 2012–14 to 29.2% in 2017.
Target 4.7: Sustainable development and global citizenship
By 2030, ensure that all learners acquire the knowledge and skills needed to promote sustainable development, including, among others, through education for sustainable development and sustainable lifestyles, human rights, gender equality, promotion of a culture of peace and non-violence, global citizenship and appreciation of cultural diversity and of culture’s contribution to sustainable development.
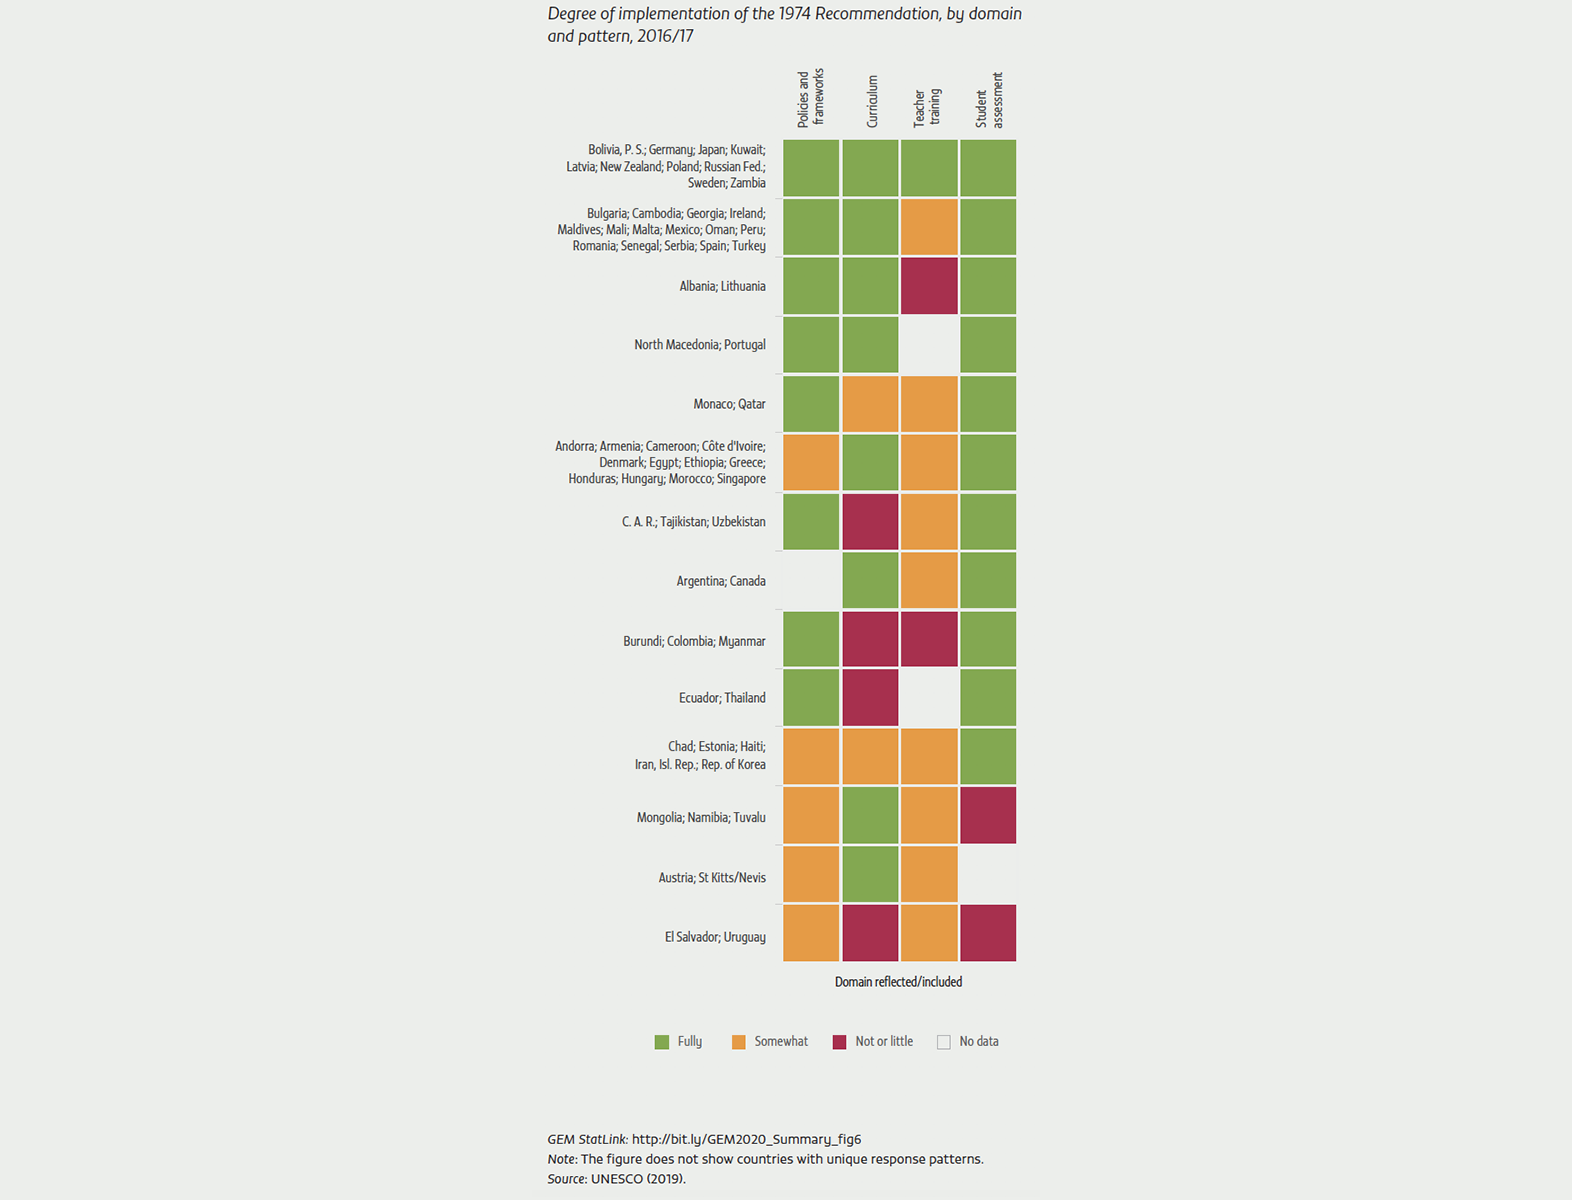
Analysis of the 83 responses to the sixth consultation in 2016/17 on the 1974 Recommendation provides a basis for discussion on global indicator 4.7.1. Only 12% of countries fully reflect or include the Recommendation’s guiding principles in education policies, curricula, in-service teacher education and student assessment. Few countries fully train teachers in the sustainable development content their policies and curriculum frameworks prescribe and on which students are assessed. In some countries, such as Burundi, Colombia and Myanmar, students are assessed even though teachers are not trained at all (Figure 6). Some 93% of countries teach prevention of gender-based violence, 34% prevention of violent extremism and 29% education for global citizenship.
While there is evidence that curricula are slowly changing to include environmental sustainability and climate change, there is no systematic international data collection on the duration of a ‘typical’ curricular reform from conception to implementation. The time it takes depends on the intensity of changes, consultations, piloting and validations. Revisions may take up to five years – longer if they are politically contentious and all stages of the process receive due attention. Significantly faster reforms are likely rushed. In Romania, textbooks on the history of minorities were introduced in two years, but teachers had not been trained when they arrived in classrooms.
FIGURE 6: In some countries, students are assessed but teachers are not trained in education for sustainable development
Target 4.a: Education faciltities and learning environments
Build and upgrade education facilities that are child, disability and gender sensitive and provide safe, non-violent, inclusive and effective learning environments for all.
An estimated 335 million girls attend primary and secondary schools that lack basic menstrual hygiene
management. Sanitation facilities may not be accessible for wheelchair users. In El Salvador, Fiji, Peru, Tajikistan
and Yemen, at least 80% of schools had improved sanitation facilities, but less than 5% of those were accessible.
In 29 countries, extreme temperatures have a negative effect on education attainment. In South-eastern Asia,
a child experiencing temperatures 2 standard deviations above average is predicted to attain 1.5 fewer years of
schooling than those experiencing average temperatures.
By February 2020, there were 102 signatories of the 2015 Safe Schools Declaration. However, more than
1,000 schools in Afghanistan were closed due to conflict in late 2018, leaving half a million children out of school.
In Burkina Faso, Mali and Niger, school closures doubled between 2017 and 2019 due to growing insecurity, disrupting education for more than 400,000 children.
While 132 countries have banned corporal punishment in schools, half of all school-age children live in countries where it is not fully prohibited. Strong opposition to corporal punishment at home is positively correlated with lower levels of corporal punishment in schools. In India and the Republic of Korea, corporal punishment in schools is much higher than might be predicted.
There are 6.2 fatalities among 5- to 14-year-olds per 100,000 people in low-income countries, which average 8 vehicles per 1,000 inhabitants, compared with 1.7 fatalities in high-income countries, where the average is 528 per 1,000 inhabitants. A survey of nearly 250,000 km of roads in 60 countries found that more than 80% with a traffic flow over 40 km/h and used by pedestrians had no pavement.
Target 4.b: Scholarships
By 2020, substantially expand globally the number of scholarships available to developing countries, in particular least developed countries, small island developing States and African countries, for enrolment in higher education, including vocational training and information and communications technology, technical, engineering and scientific programmes, in developed countries and other developing countries.
Aid for scholarships and imputed student costs totalled US$3.5 billion in 2018. Average scholarship aid per tertiary education student varies widely: Countries with similar student populations differ by a factor of 100 or more. The highest per capita scholarship flows go to small island developing states whose nationals can only study for specialized degrees abroad. Among them, Caribbean islands receive far less scholarship aid per capita than Pacific islands.
Research conducted for this Report estimates 30,000 scholarships were offered to sub-Saharan African students in 2019 by the top 50 providers, which allocate about 94% of all scholarships targeted to those students globally, according to a mapping of more than 200 providers. About 56% of the scholarships were for undergraduate study.
Government-led initiatives dominate scholarship provision for sub-Saharan African students, with China the single largest provider at over 12,000 opportunities per year. Although the volume of scholarship aid globally has stagnated since 2010, the number of opportunities available to sub-Saharan African students has increased since 2015 and will likely continue to rise in the next five years.
Scholarship providers often have no verifiable metrics on programme performance in terms of inclusiveness. Among 20 providers consulted for this Report, most could provide no detailed information on scholars’ individual background characteristics other than gender. Application and selection procedures are poorly aligned with the needs of the 60% of sub-Saharan African students studying outside the region, who also experience learning environments quite unlike what they are used to.
Target 4.c: Teachers
By 2030, substantially increase the supply of qualified teachers, including through international cooperation for teacher training in developing countries, especially least developed countries and small island developing States.
Globally, an estimated 85% of primary and lower secondary school teachers are trained according to national definitions. In sub-Saharan Africa, the shares are 64% for primary and 58% for lower secondary. Less than half (49%) of pre-primary teachers in the region are trained, and the share for upper secondary is 43%. Interpreting teacher availability data partly depends on information on teaching assistants. Data for low- and middle-income countries rarely clarify whether support staff is engaged in teaching. Data for OECD countries are more explicit and show countries including Chile and the United Kingdom relying a lot on teaching assistants in pre-primary education. Analysis of data on working hours suggests not enough is known about teacher time allocation. In at least a few cases, statutory regulations on working and teaching time might not reflect the reality.
An OECD review of nine countries confirmed pre-primary teachers may be highly qualified but not necessarily trained to work with children; the latter share is a meagre 64% in Iceland. Despite low satisfaction with salary, staff reported high job satisfaction, from 79% in the Republic of Korea to 98% in Israel.
Image credits:
Primary and secondary education: Juan Alfonso Rangel Terrazas/UNESCO
Early Childhood: Susan Warner/Save the Children
Technical, vocational, tertiary and adult education: UNICEF/Brown
Skills for work: SCUS/Save the Children
Equity: Tom Merilion/Save The Children
Literacy and numeracy: Arindam Dutta/UNESCO
Sustainable development and global citizenship: UNICEF/LeMoyne
Education facilities and learning environments: Jonas Gratzer/Save the Children
Scholarships: UNHCR/Antoine Tardy
Teachers: UNICEF/Herwig CREDIT: UNICEF/Herwig